Visualisation of GDP growth over next 5 years if B-BBEE is eliminated
A 2019 study, The impact of black economic empowerment on the performance of listed firms in South Africa, analyzed JSE-listed businesses from 2004–2019, using fixed-effects regressions1 and system GMM2 to assess B-BBEE’s impact on turnover, profits, and productivity.
The study found that B-BBEE compliance costs averaged 1-3% of annual turnover for large businesses (revenues of R50-million or more). This can be broken down like so:
- Verification and Audit Costs: Annual B-BBEE scorecard audits by accredited agencies, costing R50 000–R500 000 per business, depending on size and complexity.
- Consulting Fees: Hiring B-BBEE consultants to navigate scorecards, costing R100 000–R1 million annually for large firms.
- Skills Development: Mandatory training spend (e.g., 6% of payroll for scorecard points), averaging 0.5–1% of turnover.
- Procurement Adjustments: Sourcing from B-BBEE-compliant suppliers, which could increase costs by 5–20% for certain inputs, contributing 0.5–1.5% to turnover costs.
These costs were estimated by surveying businesses and cross-referencing financial statements for compliance-related expenses. Smaller businesses were harder hit by economies of scale where these costs rise to 5–10% of turnover.
Compliance costs reduce profitability, investment, and output. These costs impact GDP directly (through reduced production) and indirectly (through lower investment and job creation).
To estimate the economic impact of B-BBEE, let's focus on large business because we can quantify their turnover from StatsSA Annual Financial Statistics data.
In 2018, The total turnover of measured industries was R9 932 236 million (R9,9 trillion) of which the formal business sector (excluding agriculture and public sectors) had a total turnover of ±R8 trillion, with large firms contributing ±70% (R5.6 trillion).
At 1–3% of turnover, 2018 B-BBEE compliance costs for large firms range from:
- Low estimate: 1% × R5.6 trillion = R56 billion per year
- High estimate: 3% × R5.6 trillion = R168 billion per year
Adjusting those figures for 2025 factoring in GDP growth and inflation, turnover is ±R7.4 trillion. So, compliance costs for 2025 would be:
- Low estimate: 1% × R7.4 trillion = R74 billion per year
- High estimate: 3% × R7.4 trillion = R222 billion per year
But wait, you say, not all compliance costs directly reduce GDP! Some — like skills development, procurement — are spent within the economy, creating secondary effects.
Fair enough. Let's assume 50% of costs are “leaked” (e.g., via profits lost to foreign shareholders or inefficiencies), the direct GDP loss drops to:
- Low estimate: 1.6% × 50% = 0.8% of GDP (R36 billion)
- High estimate: 4.9% × 50% = 2.5% of GDP (R112.5 billion)
(I apologise to all of you who have stayed with me thus far and your eyes are glazing over. I'm trying to take into account multiple factors, hence the detail.)
There's a secondary indirect impact of compliance costs in that they deter investment and reduce productivity. A World Bank report titled South Africa Economic Update: Jobs and Inequality posits that reducing regulatory burdens could boost GDP growth by 0.5–1% annually.
Let's assume B-BBEE accounts for half of this (because we have many other regulatory burdens), eliminating those compliance costs should add 0.25–0.5% to annual GDP growth over time.
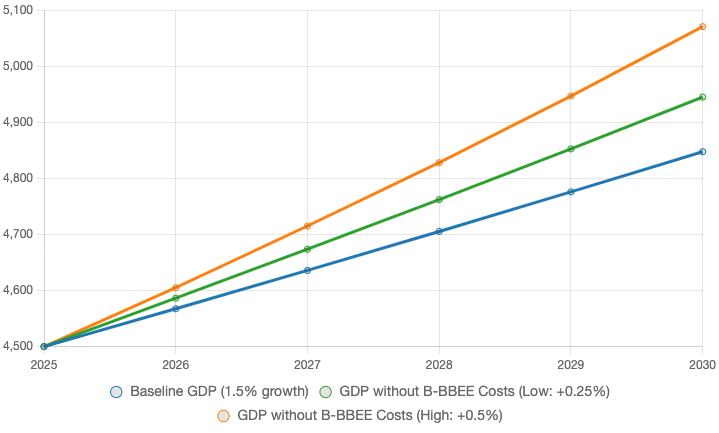
Compounded over the next five years, the uptick in investment and productivity would result in GDP increasing as follows:
- Low: (1.0025⁵ – 1) × R4.5 trillion = R56 billion
- High: (1.005⁵ – 1) × R4.5 trillion = R113 billion
So let's combine the primary and secondary effects of compliance cost elimination:
- Low Estimate: 0.8% (direct) + 1.3% (indirect, 5-year cumulative) = 2.1% GDP uptick (R94.5 billion by 2030)
- High Estimate: 2.5% (direct) + 2.5% (indirect, 5-year cumulative) = 5.0% GDP uptick (R225 billion by 2030)
Here's a table to summarise (data in R billions):
| Baseline GDP (1.5% growth) | GDP without B-BBEE Costs (Low: +0.25%) | GDP without B-BBEE Costs (High: +0.5%) | |
|---|---|---|---|
| 2025 | 4500 | 4500 | 4500 |
| 2026 | 4567.5 | 4586.3 | 4605 |
| 2027 | 4635.9 | 4673.7 | 4715.1 |
| 2028 | 4705.4 | 4762.2 | 4828 |
| 2029 | 4776 | 4852.6 | 4946.9 |
| 2030 | 4847.6 | 4945 | 5070.6 |
- 1
Fixed effects regression is a statistical method used in panel data analysis to control for unobserved heterogeneity across entities (like individuals, firms, or countries) that is constant over time. It's a type of regression model that adds a set of dummy variables (one for each group) to account for the fixed effects, effectively "absorbing" the influence of these unobserved, time-invariant factors on the outcome variable.
- 2
System Generalized Method of Moments (System GMM) is a statistical estimation technique used in panel data analysis, particularly when dealing with dynamic models and potential endogeneity issues. It's an extension of the first-differenced GMM estimator and addresses the problem of weak instruments, especially when the dependent variable is persistent (i.e., close to a random walk). System GMM combines moment conditions from both the first-differenced and level equations of the model, leading to improved efficiency and robustness.