South Africa's budget deficit for this year is R370 billion.
(That's the difference between the money government receives in taxes and the amount government spends by borrowing.)
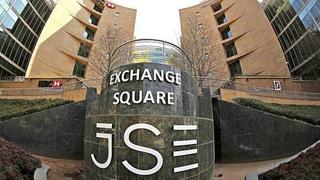
This triggered a thought as to what we could have spent that money on as a nation, and as I started by taking a look at companies listed on the Johannesburg Stock Exchange.
The useful thing about listed companies is that it's very easy to get a universally accepted sense of what they are worth. It's called Market Capitalisation, or just Market Cap for short. Take the number of shares a company has issued, multiply it by the price of one share, and boom.
So here are the top 50 companies in South Africa, courtesy of Sharenet:
| Name | Full Name | Market Capital | |
|---|---|---|---|
| 1 | PROSUS | PROSUS N.V | 1,801,739,145,630 |
| 2 | BATS | BRITISH AM. TOBACCO PLC | 1,526,825,899,496 |
| 3 | ABINBEV | Anheuser-Busch InBev SA NV | 1,476,456,362,767 |
| 4 | NASPERSN | NASPERS LIMITED | 1,080,132,935,700 |
| 5 | BILLITON | BHP GROUP PLC | 596,744,765,241 |
| 6 | GLENCORE | GLENCORE XSTRATA PLC | 558,651,462,527 |
| 7 | RICHEMONT | COMPAGNIE FIN RICHEMONT | 543,454,200,000 |
| 8 | ANGLO | ANGLO AMERICAN PLC | 510,937,425,618 |
| 9 | FIRSTRAND | Firstrand Limited | 315,365,415,416 |
| 10 | ANGLOPLAT | ANGLO AMERICAN PLATINUM CORPORATION LIMITED | 301,401,869,431 |
| 11 | STANBANK | STANDARD BANK GROUP LIMITED | 246,940,917,688 |
| 12 | VODACOM | VODACOM GROUP LIMITED | 212,941,976,826 |
| 13 | SANLAM | Sanlam Limited | 158,222,184,933 |
| 14 | CAPITEC | CAPITEC | 157,716,371,993 |
| 15 | MONDIPLCP | MONDI PLC PRE | 156,037,562,740 |
| 16 | MTN | MTN GROUP LIMITED | 146,162,805,128 |
| 17 | ANGGOLD | ANGLOGOLD ASHANTI LIMITED | 132,184,054,369 |
| 18 | OLDMUTUAL | OLD MUTUAL PLC | 124,638,459,519 |
| 19 | SIBANYE | SIBANYE GOLD LIMITED | 118,362,396,741 |
| 20 | SASOL | SASOL LIMITED | 116,595,053,673 |
| 21 | ABSAG | ABSA GROUP LIMITED | 114,454,819,171 |
| 22 | SOUTH32 | South32 Limited | 112,272,373,920 |
| 23 | IMPLATS | IMPALA PLATINUM HOLDINGS LIMITED | 105,927,956,867 |
| 24 | RMBH | RMB HOLDINGS LIMITED | 102,164,961,886 |
| 25 | BIDCORP | BID Corporation Ltd | 99,450,702,900 |
| 26 | KUMBAIO | Kumba Iron Ore Ltd | 97,688,675,914 |
| 27 | SIBANYE-S | SIBANYE STILLWATER LTD | 92,849,592,240 |
| 28 | GFIELDS | GOLD FIELDS LIMITED | 92,573,352,686 |
| 29 | REMGRO | REMGRO LIMITED | 86,839,218,678 |
| 30 | NEDCOR | NEDBANK GROUP LTD | 85,935,585,839 |
| 31 | OMUTUAL | OLD MUTUAL LIMITED | 78,020,733,963 |
| 32 | SHOPRIT | SHOPRITE HOLDINGS LIMITED | 73,456,068,718 |
| 33 | NEPIROCK | NEPI ROCKCASTLE PLC | 72,773,394,397 |
| 34 | DISCOVERY | DISCOVERY HOLDINGS LIMITED | 67,553,795,328 |
| 35 | CLICKS | CLICKS GROUP LTD | 65,278,260,151 |
| 36 | BIDVEST | THE BIDVEST GROUP LIMITED | 63,580,261,550 |
| 37 | REINET | REINET INVESTMENTS SCA | 62,997,082,861 |
| 38 | NORTHAM | NORTHAM PLATINUM LIMITED | 60,077,715,834 |
| 39 | QUILTER | QUILTER PLC | 56,668,060,209 |
| 40 | GROWPNT | GROWTHPOINT PROPERTIES LIMITED | 55,734,833,284 |
| 41 | PEPKOR | PEPKOR HOLDINGS LIMITED | 55,108,043,919 |
| 42 | INVPLC | INVESTEC PLC | 54,238,757,594 |
| 43 | MEDCLIN | Mediclinic Int plc | 52,690,815,100 |
| 44 | ASPEN | Aspen Pharmacare Hldgs | 49,661,927,660 |
| 45 | PSG | PSG GROUP LIMITED | 45,808,131,646 |
| 46 | MCGROUP | MULTICHOICE GROUP LTD | 42,574,144,750 |
| 47 | EXXARO | EXXARO RESOURCES LIMITED | 42,359,680,579 |
| 48 | MRPRICE | MR PRICE GROUP LIMITED | 39,996,315,121 |
| 49 | RMIH | RAND MERCH INS HLDGS LTD | 39,336,823,533 |
| 50 | WOOLIES | WOOLWORTHS HOLDINGS LIMITED | 38,848,170,658 |
Let's look at some of our favourite retailers: Woolies market cap comes in at a modest R38,85 billion; Mr Price comes in at R39,99 billion; Pepkor at R55,10 billion; Clicks at R65,27 billion; Shoprite at R73,45 billion. Let's throw in Growthpoint Properties at R55,73 billion (because they are landlords of a lot of those retail outlets) and let's add Multichoice at R42,57 billion (because we need entertainment).
That gives us a nice total of R370 billion.
Yes, my fellow South Africans: with our overspend of R370 billion this year, we could have bought out Woolies, Mr Price, Pepkor, Clicks, Shoprite/Checkers, Growthpoint Properties, and Multichoice.
What is our government spending that money on? Yes, salaries for public servants.
